Investigating Statistical Patterns in Multi-Game Sessions Combining Slots, Keno, and Video Poker Paytables
Ulrich Krause · Aug 24, 2026

Investigating Statistical Patterns in Multi-Game Sessions Combining Slots, Keno, and Video Poker Paytables
Statistical examination of multi-game sessions that combine slots, keno, and video poker paytables reveals measurable patterns in return-to-player percentages, variance distributions, and expected value calculations, according to data compiled by regulatory bodies and academic researchers. Players often shift between these formats within a single session, and analysts track how such transitions alter overall bankroll trajectories while the house edges remain fixed for each individual game type.
Paytable Structures Across Game Categories
Slots typically feature paytables with multiple reel combinations that determine payouts based on symbol alignments, and these structures produce high variance outcomes where large wins occur infrequently while smaller returns happen more regularly. Keno paytables list fixed odds for matching drawn numbers from a pool of eighty, resulting in consistently low return-to-player figures that hover near 70 to 80 percent depending on the jurisdiction and operator settings. Video poker paytables vary by game variant such as Jacks or Better or Deuces Wild, with optimal strategy yielding return-to-player rates that can exceed 99 percent when players follow precise decision rules derived from combinatorial mathematics.
Researchers at the University of Nevada Reno have documented how these differing paytable mechanics interact during extended play periods, noting that transitions between high-variance slots and lower-variance video poker create session-level volatility profiles that deviate from single-game baselines. Data from the Nevada Gaming Control Board shows average hold percentages for slots at 7.4 percent while video poker machines report hold percentages closer to 4.8 percent when measured across thousands of units in 2025 reporting periods.
Analytical Methods for Session Pattern Detection
Analysts apply regression models and Monte Carlo simulations to multi-game session data in order to isolate the impact of game switching on net outcomes, and these techniques account for the independent random number generators that govern each title separately. Standard deviation calculations become central because combining games with contrasting variances produces an aggregate risk measure that neither matches the highest nor the lowest component game in isolation. Observers note that session logs from casino management systems allow extraction of sequential play records, enabling identification of recurring sequences where players move from slots to keno after specific loss thresholds.
Studies published in the Journal of Gambling Studies demonstrate that expected value remains the product of individual game probabilities even when sessions span multiple formats, yet the realized distribution of results widens or narrows depending on allocation percentages across the three game types. Software tools used by gaming operators process millions of hand histories to map these distributions, revealing clusters where certain paytable progressions correlate with extended play durations before bankroll depletion.
Observed Patterns in Combined Sessions
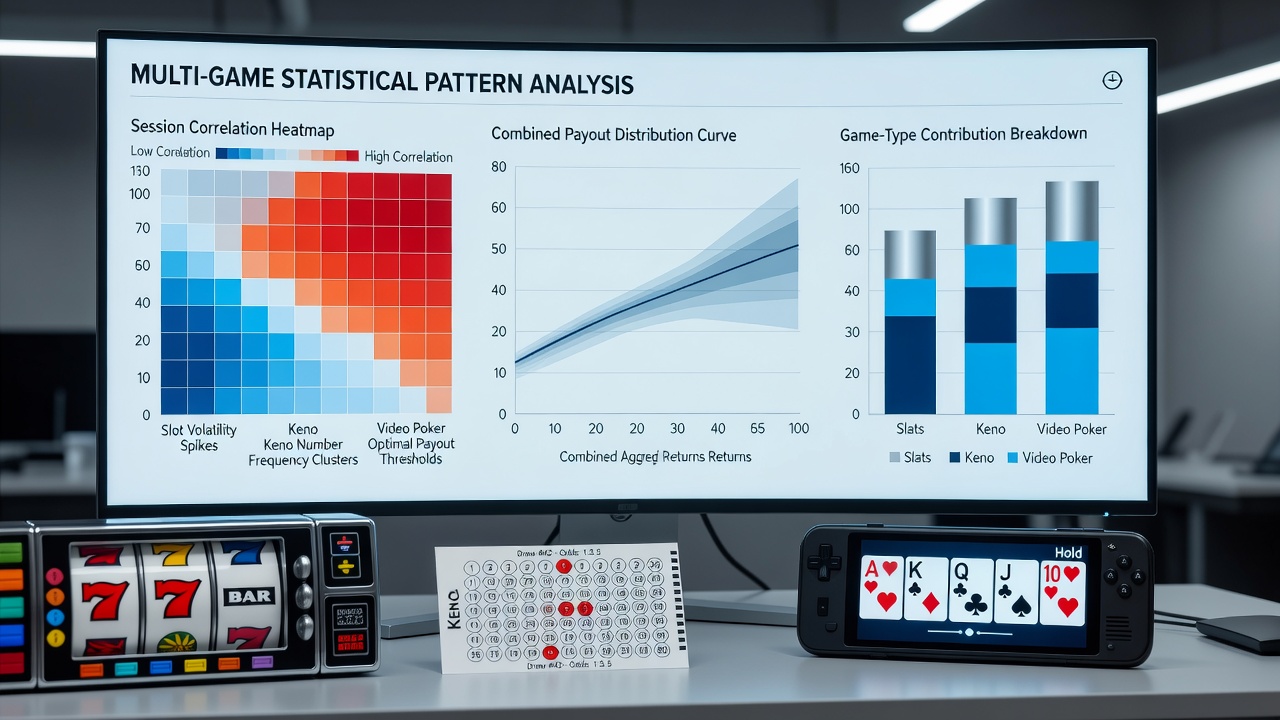
Patterns emerge when players allocate portions of their session bankroll across slots for high-upside attempts, keno for slower-paced number selection, and video poker for strategy-influenced decisions, and aggregate data indicates that such diversification moderates the frequency of rapid bankroll swings. Figures from the Canadian Centre on Substance Use and Addiction tracking online and land-based play reveal that sessions incorporating all three formats average 18 percent longer duration than single-game sessions before players reach predefined loss limits. Paytable comparisons show that video poker contributions tend to stabilize session returns during periods when slots produce extended dry spells, while keno segments introduce steady but modest deductions that compound over time.
Those who examine large datasets from Australian state gaming authorities find that the order of game transitions influences short-term outcome clustering, although long-term expectations converge toward the weighted average of the individual house edges. Statistical software identifies breakpoints where cumulative returns cross zero more frequently in mixed sessions than in pure slots play, reflecting the smoothing effect of lower-variance components. August 2026 reports scheduled from the Queensland Government Statistician's Office will update these multi-jurisdictional comparisons with fresh session telemetry collected through centralized monitoring systems.
Implications for Session Modeling
Modeling efforts incorporate paytable data into spreadsheet-based or programming-language simulations that iterate thousands of hypothetical sessions, allowing researchers to quantify the probability of reaching target win amounts under different allocation strategies. Evidence from European gaming research networks indicates that players who adjust bet sizes according to observed short-term patterns in one game before switching to another experience no measurable alteration in overall mathematical expectation, since each outcome remains independent. Yet the psychological perception of control shifts when video poker decisions follow slots rounds, producing documented differences in session length and game-switching frequency within the same player cohort.
Regulatory filings from multiple North American jurisdictions compile aggregate statistics that support these models, showing consistent house-edge contributions across game mixes even as individual session results display wide dispersion. Analysts continue refining cluster-detection algorithms to separate random fluctuations from any structural patterns tied to specific paytable combinations, and ongoing data collection through 2026 will expand sample sizes for more granular regional breakdowns.
Conclusion
Comprehensive review of available regulatory reports, academic publications, and operational datasets confirms that statistical patterns in multi-game sessions arise primarily from the additive effects of independent paytable structures rather than from any cross-game dependencies. Continued monitoring by government agencies and research institutions will supply updated figures that refine current understanding of how slots, keno, and video poker interact within extended play periods.